Showing posts with label climate science. Show all posts

Tuesday, October 8, 2013

Australian heat records keep tumbling

Another heat record has tumbled as Australia's year long heat wave continues. Australia has (again) broken the record for warmest 12 months on record after previously breaking it only last month.

The heat in September was something else, at +2.75 °C above the long-term (1961–1990) September average. Naturally this was the warmest Sept on record, what's more amazing is that in the last hundreds years of temperature records, no month has ever been more above the long term average. On in meteorology speak Sept 2013 "sets a record for Australia’s largest positive anomaly for any monthly mean temperature."


Friday, September 27, 2013

Australia has hottest 12 months on record

If you felt it's been hot where you live recently, you're right. Recently the Bureau of Meterology (BOM) announced that the last year has been Australia's hottest 12 month period on record.

This information is containing in a short report you can find here and summarised here. Along with the warmest 12 months, a host of other records have also been broken in individual towns and cities and right across the nation. Because Australia is so big it takes a massive buildup of heat to break countrywide records, some of the most important I've taken from the report and shown below.


"The last 12 months saw a large number of temperature records set across Australia, including:
  • Australia’s hottest summer day on record (7 January) 
  • Australia’s warmest winter day on record (31 August) 
  • Australia’s warmest month on record (January) 
  • Australia’s warmest summer on record 
  • Australia’s warmest January to August period on record 
  • Australia’s warmest 12 month period on record"
Here's a map from the Bureau showing how the whole country has been warmer than normal this past year.


Overall the last year has seen temperatures 1.11 ̊C above average. While that may not sound like all that much, across a whole country, for a whole year, this gives us weather that's noticeably hotter.

Since the first half of the 20th century (1900-1950) temperatures across Australia have risen by ~0.75  ̊C and between now and 2050 are likely to rise by another 2 ̊C or more. This mean's that by 2050 the temperatures we have had over this past year (including the record breaking summer heat) would by then be a much colder than average year. A normal year would be a least a degree hotter than the past 12 months and a record breaking year could see temperature anomalies 3 or 4 times greater than experienced over the past year. Something to think about as Australia goes about dismantling all its policies to combat global warming.

Friday, March 22, 2013

2012-13 Australian summer was the hottest on record

If you thought the summer we just had was hot. You were right, the 2012-13 summer we just had was the hottest Australian summer on record.

This and other facts are outlined by two scientists from the Bureau of Meteorology here.

Some other interesting facts:

  • Janurary 2013 when we had that massive heatwave was the hottest month in Australia on record, hotter than every other month going back to 1910.
  • Sept 2012 - Feb 2013 was the hottest 6 month period on record.
  • This record hot summer occurred without an El Nino event. El Nino's give temperatures a short term boost and generally mean hotter summers for Australia  (the previous three hottest summers all occurred in El Nino years). This is consistent with increasing temperatures allowing records to fall without an El Nino "bump".
  • This last summer saw record heat across the southern hemisphere land mass as a whole.
  • "Six of Australia’s ten hottest summers on record have come in the last 11 years, meaning that very hot summers have been occurring at about five times the rate you would expect without a warming trend"
  • "With higher average temperatures come more extremes of heat. In the last decade, record high temperatures have outnumbered record low temperatures in Australia by a ratio of about three to one"


Sunday, January 13, 2013

The heat is on

If you are in Australia and are reading this, you'll know it's been hot lately, really hot, unprecedented in fact.


 So how hot has it been? Well, last Monday the 7th of January was the hottest day in Australia since records began (check out the statement from the Bureau of Meteorology (BOM) here). Not only that, but the first 8 days of 2013 were all amongst the top 20 hottest days since records began. So even by last Tuesday the length of a heatwave of this intensity was unprecedented. Currently the BOM data was last updated on the 9th, but the heat has continued, so it will be interesting to see how many more records have been broken.

So this really is an unprecedented heatwave, not only has it been bloody hot, but the area covered by the heatwave has been huge. It is always interesting when a single region breaks its all-time temperature record, as Hobart did on the 4th of January. But think about the amount of heat needed to break a record in a single place, and then think about the amount of heat required to break the heat record for a country the size of Australia and you can see which is more significant.


It is also worth noting that not only was the Australia-wide maximum temperature record set on the 7th, but so was the record for the highest minimum temperature, until it was broken again the next day, that is.

Less appreciated, but also interesting is how long this heatwave (in the broader sense) has actually been going. According to the BOM, the last four months of 2012 were the hottest on record, so in some respects this current heatwave actually started in September.

Combine this unprecedented heatwave event with record heat over the last 4 months and very dry conditions since mid-2012 and it is no surprise that bushfires have followed.


Unprecedented heatwaves such as what we are currently experiencing raise the question of if climate change is involved. The answer, quite simply, is yes. I had been trawling through Australian climate data on the BOM website to help show this, but thankfully several climate scientists have written a short report to do my homework for me (it's only a couple of pages so I recommend you download it if you want to know more).

Over the last ~50 years average temperatures in Australia have risen by more than half a degree, a trend that has also played out worldwide. Looking at the data you can see the whole country has been getting warmer. So we can see that our climate has already changed, it is hotter than it used to be and this means more heatwaves, hotter heat waves and/or longer heatwaves.

Or, think of it this way. The maximum temperature each day can be described using the "bell curve" in the picture below. Average temperatures are those that occur most often and they represent the tallest part of the curve. Temperature extremes (both low and high) are rare and so form the left and right hand edges of the curve.


What global warming is doing is pushing the curve to the right (called "new climate"). This means the temperatures that occur most often (the "mean") are now warmer. But perhaps more importantly, what was previously hot weather (ie: a heatwave) that occurred rarely is now more common and new record hot temperatures now become possible.

We are seeing this in Australia. Warming has lead to increases in the number in hot days (over 35 degrees) and hot nights. While record hot days are now outstripping cold records 3:1, with the number of record hot days doubling since 1960 (ref). So while it wouldn't be accurate to say that global warming has caused this current heatwave, we do know it is making heatwaves more common, more severe and more likely to last longer. Global warming is worsening this heatwave and (although this will need to be tested by climate scientists) the unprecedented nature of the heatwave makes it quite possible that a heatwave of this magnitude simply would not have occurred without global warming.


And what of the future? Well as climate scientist Professor David Karoly points out, over the next 50 years we are expecting:
 "two or three times the warming we've seen already leading to much greater increases in heatwaves and extreme fire danger days".

In other words, the unprecedented nature of this heatwave won't stay unprecedented for long.

Tuesday, September 25, 2012

Goodbye to arctic sea ice

The arctic sea ice is being obliterated. As has been widely reported, the sea ice melt this northern summer has smashed all previous records, shrinking to the smallest extent, area, and even more crucially volume on record. 

The arctic is one of the fastest warming places on earth and is already undergoing large changes due to global warming. One of the most obvious examples of this is the arctic sea ice. This is the frozen covering of ice that sits on top of the arctic sea, stretching from Greenland over the north pole to the top of Russia and around past Alaska and the Candian arctic. Every spring and summer the 24 hr sunlight and warmer temperatures melt the ice back northward and before it refreezes again in autumn and winter.

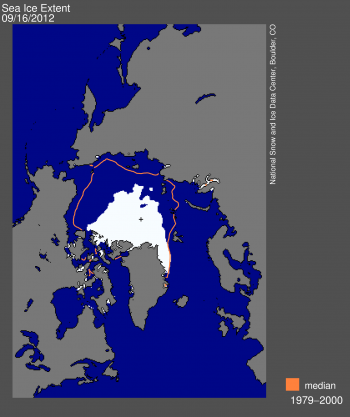
At the end of the 2012 met season sea ice extent had shrunk to just 3.41 million square kilometers according the US National Snow and Ice Data Center (NSIDC), 18% lower than the previous record in 2007 and 49% lower than the long term average. And unlike 2007, 2012 didn't have close to ideal weather conditions for melting ice either. The figure from NSIDC below shows the area of ice extent at the 2012 minimum (white) compared to the long term average (red line)


So why, with worse weather for melting did 2012 break all melting records? The answer probably lies in the volume of ice left. The volume of arctic ice basically relates to it's thickness, with thicker ice less likely melt in the summer. Since the late 70's, arctic sea ice has lost roughly 3/4 of it's volume, including big losses since the last extent (area of sea covered by 15% ice) record in 2007.You can see this progression on the animated chart below thanks to Tamino. Put simply the ice today is thin and weak and it doesn't take much to melt it.


So where to from here. Well, the bad news is that melting arctic ice causes a positive feedback loop. Ice reflects almost all incoming sunlight back in space, while open water absorbs almost all the sun's energy. So, when more ice melts, there is more open water to absorb the sun's rays, heating up the water and melting more ice. This means that the amount of ice is going to keep decreasing, (especially with continuing increases in arctic temperature due to global warming) with a number of predictions that the arctic might be seasonally ice free within a decade or so. Ice will continue to refreeze in winter, but it will be thin and weak and since there isn't much sun in the arctic that time of year it won't make that much difference to the amount of sunlight reflected whether it is there or not.

The arctic meanwhile is going to become a very different place. The loss of sea ice will accelerate arctic warming and completely disrupt the habitat of many of the species that live on or under the ice. Warming is also changing the arctic land environment as well. More importantly for those of us who don't live there, the arctic also plays an important role in northern hemisphere weather and some scientists have pointed the finger at changes in the arctic for extreme weather events in Europe and North America. For example: allowing cold arctic air to "break out" of the arctic and head south to chill the aforementioned regions. You can also find more about this on Skeptical Science.

Lastly, the massive loss of ice in the arctic demonstrates us just how fast things can change. No-one expected the unprecedented ice loss in 2007 and indeed IPCC model forecasts made before the 2007 melt season were not predicting the loss of summer sea ice until near the end of the century. Yet here we are with the possibility it will be gone by the end of the decade. This should remind us conducting an uncontrolled experiment on the earth's climate is going to have surprises, (and probably not many good ones) and that ecosystems can be much more vulnerable to destruction than we realized. It's too late to stop what's happening in the arctic, that would have required taking proper action of global warming decades ago, and only by taking action to halt global warming can we prevent the kind of breakdown occurring in the arctic from happening elsewhere, such as to the great barrier reef.

Thursday, May 17, 2012

Australasian warming since 1950 unmatched over last 1000 years

As widely reported in the media, Australian scientists have for the first time created a detailed 1000 year reconstruction of temperatures in Australasia. Although there were no man made thermometers over most of this time, nature contains a number of natural thermometers (like tree rings, corals and ice cores) that scientists can read to piece together many details of temperature and climate in the past. By combining records from a number of different sites scientists have created a temperature record stretching back to AD 1000.

Three main conclusions can be drawn from this paper:

  1. The warmth of the climate in Australasia post-1950 is not equaled or surpassed by any time period in the last 1000 years.
  2. The hottest 30 year period was 1970-2000.  (Nb1: the record did not carry on past 2000, Nb2: 30 years is a standard length of time used to look at "climate" as opposed to short term temperature fluctuations)
  3. "The unusual 20th century warming cannot be explained by natural variability alone, suggesting a strong influence of anthropogenic forcing (human caused warming) in the Australasian region"

The figure below show's their temperature reconstruction (click on it to embiggen):


Figure 4: Reconstruction of australasian temperatures since 1000 AD compared to 1961-1990 average from thermometers. Black line is 30 year average temperature. Green line is thermometer temperature record for Australasia. Thick black line shows periods with most reliable measurements, thin black line shows when temperature measurements are not so reliable. Shading above and below average line shows the uncertainty of the measurement (this represents the fact that the true average temperature may not be exactly what was reconstructed and shown in the black line, however there will be a very high likelihood the true temperature was within the shaded region).
Both the temperature increase and temperatures in recent times are not matched elsewhere on the graph. Note that although the top of the shaded uncertainty plots do rise above the 1961-1900 average temperature on several occasions the evidence does not support them being warmer. Whereas in recent times the average reconstructed temperature including uncertainty has risen above the 1961-1900 average temperature.
From Gergis et al, 2012. Copyright 2012 American Meteorological Society


Abstract of scientific article can be read here, unfortunately the full paper is behind the journals paywall.


Reference: 
Gergis, J., R. Neukom, S. Phipps, A. Gallant, and D. Karoly, 2012: Evidence of unusual late 20th century warming from an Australasian temperature reconstruction spanning the last millennium. J. Climate. doi:10.1175/JCLI-D-11-00649.1, in press.

Monday, July 18, 2011

Being skeptical of the skeptics - Bob Carter edition

Adj Prof Bob Carter is one of Australia's most prominent climate "skeptics". Unlike most climate "skeptics" he is a scientist, although the number of scientific papers he has published on climate change are few to nonexistent).

A couple of months back Bob gave a talk to the Sydney Mining Club where he repeated many of his claims, including that the planet is not warming due to greenhouse gasses and that he doesn't think it is warming at all. Personally I'm skeptical of his claims and I'm not the only one, a statistician/ climate scientist who blogs under the name Tamino, decided to do what real skeptics do and test Bob's claims.

The result (which I highly recommended people read if you have time) is an incredible demolition of Carter's claims. Here's just one of them.

Bob takes the temperature record of the lower atmosphere as determined by satellites (which started in 1979) and claims it doesn't show warming. He then claims that temperature trend is for flat temperatures before and after 1998 with a jump in the middle. Here's the slide:


Scientifically this is bizarre, the correct way to check for warming is to calculate the trend over the entire series, but Bob doesn't like this idea (hint: it shows warming). But actually it gets worse because it turns out his red "trend lines" are not trend lines at all. He just made them up to show the answer he wanted, which was no change in temperature. How do we know? Because when Tamino calculated the change in temperature over this time period he got this.


In both cases the trend is up, ie: temperatures increased.

But I'm a skeptical person so I shouldn't just take Tamino's word. So I went and drew some trends too using the same data. It's easy, you can do it here.
I checked the temperature trend in the atmosphere since 1979 and the trend since 1999 (Carter's second red line) and lo and behold I found that Tamino was right and Carter's "trend" was fake.


What Carter has done wouldn't be acceptable for a first year university student, but Carter is suppose to be a scientist and this is just one of the errors in his presentation.
From all this I draw two conclusions.
1. Whatever credibility Carter once had in the climate debate, it's gone.
2. It is good, although time consuming, to be skeptical of both those you agree and disagree with. That way you know, as Whitey Ford said, "who's real and who's faking".

Saturday, March 12, 2011

Garnaut: Climate science has "strengthened" since 2008, calls out media for false "balance"

"observations and research outcomes since 2008 have confirmed and strengthened the position... that the Earth is warming and that human emissions of greenhouse gases are the primary cause"

Prof Ross Garnaut, has been releasing a series of updates to his 2008 climate change review. The latest is to update the science of climate change.

Garnaut concludes that the science showing the world is warming and that humans are responsible has become more certain since 2008. The report also concludes:
"The statistically significant warming trend has been confirmed by observations over recent years:
    • global temperatures continue to rise around the midpoints of the range of the projections of the Intergovernmental Panel on Climate Change (IPCC) and the presence of a warming trend has been confirmed;
    • the rate of sea level rise has accelerated and is tracking above the range suggested by the IPCC; and
    • rates of change in most observable responses of the physical and biological environment to global warming lie at or above expectations from the mainstream science."
Scientists, and especially the IPCC (which works by consensus) are often cautious with their conclusions. Garnaut finds evidence for this noting that:

"It is an awful reality that no major developments in the science hold out realistic hope that the judgements of the 2008 Review erred in the direction of overestimating the risks of climate change."

In his press conference Garnaut also points out that many the media are doing a poor job of explaining the science as they will:

"seek to provide some balance between people who base their views on the mainstream science and people who don't. That is a very strange sort of balance. It is a balance of numbers of words and not a balance of scientific authority"
This false balance is well known, given that some 97% of climate scientists agree that humans are causing global warming, giving the other 3% (and various non climate scientist "skeptics") 50% of the airtime creates the illusion of controversy. Of course some don't even bother to find a "skeptical" "scientist", a self described weather forecaster who previously wrote a book on reading cats paws is a good enough expert for some in the media.

Sunday, February 20, 2011

Increased flood risk linked to global warming

"Likelihood of extreme rainfall may have been doubled by rising greenhouse-gas levels"

Two very topical scientific papers have just been published in the prestigious journal Nature showing a connection between human caused climate change and the increasing intensity of rain and snow and the increased risk of serious flooding. For more see here and here.

It has long been known that a warmer atmosphere holds more water and an observed increase in extreme precipitation events has been documented but this increase had not been formally tied to human caused climate change. Two groups of scientists have now found humanities' fingerprints on the increased rainfall in the northern hemisphere in the later 20th century and in increasing the likelihood of a specific extreme flood in Britain back in 2000 (perhaps up to twice as likely).

So while it is still true that climate change does not solely cause an extreme weather event such as a unprecedented flood, it is clearly possible for climate change (and hence human activity) to make one more likely.

The present studies looked at the northern hemisphere and a flood in the UK only, so the results do not directly extrapolate to the flooding we have recently experienced. Such a "fingerprinting" analysis may well already be underway but it will be some time before we hear the result. The results though, show that the effects of climate change are already being felt and point towards a future where (globally) extreme rain and flooding events are much more common if we don't curtail our greenhouse gas emissions.

Tuesday, February 1, 2011

Citizen science opportunities in climate science

Citizen science projects involve members of the public helping scientific research by collecting or processing scientific information. With large numbers of people contributing research projects that would be too laborious for a handful of scientists to carry out become possible.

Citizen science projects have great applicability to climate science given the enormous amount of data that can be collected worldwide to inform our understanding of the climate. They are also very useful for gathering historical data. The further back through history we go the more sparse our data on temperature and climate. Much data does exist though in old log books which if digitized can improve our understanding of past climate.

Climate citizen science initiatives include Old Weather (which transcribes ship logbooks to gather otherwise sparse ocean data) and Data Rescue at Home (digitizing various historical weather records from around the globe). So if you have a few spare hours, or want something else to do while watching the cricket, why not help improve our understand of the world?

Ps: If anyone is familiar with other climate citizen science projects, leave a comment.

Friday, January 21, 2011

2010: Warmest/Equal Warmest and Wettest year on record

Some of us may have been more preoccupied with flooding but several of the groups of scientists who take the earth's temperature have now reported back on 2010.

NASA reports that 2010 was the warmest year on record (going back to 1880), but so close in temperature to the next warmest year (2005) that the two are in a tie due to the margin of error in their measurements. The NASA graph below shows the steady warming of the climate since the 1970's.


NOAA, (essentially the American equivalent of the BOM) also find 2010 to be tied with 2005 for the warmest year of record. NOAA do more than just temperature though and also reported the interesting finding that 2010 was the wettest year on record globally, which is at least partially attributable to the El Nino and La Nina conditions experienced in 2010.

Both satellite datasets measuring the temperature of the lower atmosphere (which are separate to the surface temperature above) showed 2010 as the 2nd warmest year behind 1998, although again the difference was within the margin or error.
Why do the satellite datasets, but not the surface datasets above show 1998 as being part of the record hottest? I believe this is due to the lower atmosphere being more sensitive to the short term warming effects of El Nino and cooling effects of La Nina. 2010 was mostly dominated by an moderate to strong El Nino, 1998 had a record strong El Nino, whereas the 2005 El Nino was weaker. Given this, it is no surprise 1998 is more prominent in the satellite data. The fact that 2010 essentially tied with 1998 despite a considerably weaker El Nino hints at the growing warming influence of greenhouse gasses.
Overall, despite a bit of jostling for top spot between individual years, the different datasets agree very well and show similar long term warming trends.

And for the future? This prediction is from the head of the NASA group measuring the earth's temperature:
"If the warming trend continues, as is expected, if greenhouse gases continue to increase, the 2010 record will not stand for long," said James Hansen, the director of GISS.

Sunday, December 12, 2010

NASA stunner: Warmest November on record, 2010 Meteorological Year Warmest as well

November 2010 was the warmest November on record according to NASA temperature data. While this might not seem surprising for a year that has already seen record warm months, Novembers record comes in the midst of a moderately strong La Nina, (a short term climate variation that causes a temporary cooling of temperatures worldwide due to the effect of cooler sea temperatures in the pacific) and during a prolonged minimum of the solar cycle.

Here's the NASA November temperature anomaly map:


Colours a how much the temperature was above (or below) the 1951-1980 average. The map clearly shows the La Nina (blue/ cooler than normal sea temperatures in the tropical pacific) as well as the cold temperatures in the UK that have been getting so much attention. Turns out though that this is totally negated by warmer than normal temperatures pretty much everywhere else, especially in and around the Arctic.

"According to NASA climatologist and Goddard director James Hansen, the main driver for the increased warmth was the Arctic, where temperatures in Hudson Bay were "10˚C above normal" for November. That month, Hansen says, "sea ice was absent while normally that [body of water] is covered by sea ice." Water devoid of ice absorbs much more solar radiation than water covered with ice, which reflects much of the radiation back toward space."
Unlike the calendar year, the Meteorological Year runs from Dec to Nov. With the Nov 2010 data now in 2010 is the warmest in the 130 year record at 0.65 dC above the long term average, surpassing the last record of 0.62 set in 2005. It now looks almost certain the 2010 calendar year will also set a record. Whether the 2010 record is enough above 2005 to be statistically significant remains to be seen, but it certainly reinforces the trend of rising global temperatures.

Here's the NASA map for the 2010 Meteorological Year temperature anomalies.


Again this is temperatures compared to the 1951-1980 average. Note: NASA make all of this data publically available and you can view temperatures graphs and create you own maps etc here.

Update: some commentary from NASA can be found here.

Saturday, December 4, 2010

Hotheads, airheads and hardheads: Climate change reporting and The Australian

The Weekend Australian has launched a vigorous defense of its reporting on climate change. This particular ball seems to have got rolling when editor Chris Mitchell starting threatening to sue academic Julie Posetti for defamation. Her “crime”? Tweating the musings of a former journalist at The OZ about what it was like to report on climate change (not a happy time it seems). Lost to The OZ seems to be this audio recording of former said journalist, backing up the content of the tweats. (Also see here and here for more reaction).

Amusingly, after essentially trying to shut down criticism of their climate change coverage, The OZ then launched into a defense of publishing all and any opinions about climate change.

“There is no dispute that The Australian has opened its news and opinion pages to a wide range of views on the existence and extent of climate change”.

Scientifically there is no doubt about the “existence” of climate change (the IPCC called the evidence “unequivocal”) and The OZ spends half the editorial saying they accept the science, so to defend publishing views that question the “existence” of climate change is to defend the publishing of information you know to be factually incorrect. This is false balance at the expense of accuracy. Oddly enough, just posting an online comment under one of their stories comes with the message that your comment may not be posted if it contains obvious errors of fact. So how come this seems to be ok in opinion articles and more worryingly in news articles, which readers should be able to expect are factually accurate?

One of my "favorites" in this area is this opinion piece. Here, the author starts off his ridiculous diatribe that the world is rapidly cooling towards an ice age by claiming that temperatures fell by 0.7 degrees in 2007, completely at odds with reality and such a bizarre thing to say I can only assume the author simply made it up. But this is apparently ok to publish without any fact checking, cos, you know, all views are equally valid or something.

Now to be fair, this example is from an opinion piece, which are liable to be full of nonsense, and The OZ’s main argument is that they accept the science and, news coverage notwithstanding, this is reflected in their editorials

“While the views of climate sceptics have been represented in the news and opinion pages of the newspaper they have not been reflected, and have been seldom mentioned, in the paper's editorials”
The OZ cites many editorials including one from the 12th of March 2010 where they said:

“For the record, The Australian has long accepted the probability of anthropogenic climate change and favoured the introduction of an emissions trading scheme”

but this very same editorial also said:

“But reputable scientists and stakeholders deserve their say, regardless of whether they subscribe to a newspaper's editorial line. This is why we have published views as diverse as those of geologist Ian Plimer..”

Except that Plimer ruined his reputation by publishing a error riddled book on climate change containing many bold but incorrect claims for which he has systematically refused to either provide supporting scientific evidence, or retract. This kind of behaviour is a death knell for scientific credibility. It also highlights one of the major criticisms of the media's coverage of climate change, “skeptics” don’t seem to require any credibility to be taken seriously by the media. Or as nobel prize winning energy secretary Steven Chu said “If you look at the climate sceptics, I would have to say honestly, what standard are they being held to? It’s very asymmetric. They get to say anything they want”

This March 12 editorial also said:

“Climate change is a new, inexact and contestable science, and the computer modelling on which all of the more alarming claims depend are only ever as good as the data fed in. As well as greenhouse emissions, that data should take account of other determinants of temperature, primarily the sun and the heat of the earth's core. Current predictions for sea-level rises range from a few centimetres to catastrophic levels of several metres that would swamp coastal areas. Faced with such variations, it would be negligent not to examine first-hand observations, even when they contradict the results churned out by laboratory computers.”

There is a lot wrong with this paragraph but before I break it down, re-read it and consider how it gels with their statement “the views of climate sceptics… have been seldom mentioned, in the paper's editorials”. You don't, of course, actually have to quote "skeptics" to push their views.

New, inexact and contestable: Climate science really begins with Svante Arrhenius, who was first to calculate how much the world might warm if C02 was doubled, in the late 19th century. But to be charitable to The OZ, you could say the field didn’t start to get broad agreement and knowledge till the 1979 Charney report which predicted a rise of ~3 dC for a doubling of C02, something that ~30 years on is still our best estimate. And in case you think 30 years is a short time in science, well that makes it older than most of molecular genetics (DNA sequencing, the human genome project, DNA fingerprinting etc), but no-ones calling that a “new”, or “inexact”.
Furthermore, all science is “contestable”, except that real scientists do their contesting in the peer reviewed scientific literature. Most “skeptics” are not doing science, they are doing PR, which is why they “contest” in the media.


Models: The skeptic obsession with computer models is really quite bizarre. Knowledge of climate is based on an understanding of the physics of the atmosphere and the greenhouse effect. On top of this (as Jim Hansen has explained) our knowledge comes from: 1) understanding how and why climate changed in the past and 2) observations of how the climate is responding today. Models come third and are partially used to save modern scientists the several years Arrhenius spent doing all these physical calculations by hand.


Heat from the earth's core: The scientific literature shows that heat from the earth's core equates to less than 0.1 Watts per square meter. Energy from the sun is 342 W/M2, while the back-radiation from the greenhouse effect is 324 W/M2, thousands of times larger. Just the increase in greenhouse gas heating equates to ~3 W/M2, over 30 times larger. So heat from the core is insignificant and yeah models take the sun into account. I hope the issues with this statement was just basic ignorance.


Sea level: The current rate of rise is 3.2 mm per year or 32 cm per century. So a few cm is out. Also this rate is likely to increase as thermal inertia means melting of icesheets (i.e.: Greenland and West Antarctica) starts slowly before gathering pace. Uncertainties in how fast this melting will occur explains much of the varied predictions for sea level.
Sea level around the world is based on long term observations from tidal gauges and now measured with incredible precision by satellites. The agreement is excellent. Does the writer know what a scientific observation is? And yes these observations are “churned out by laboratory computers” in so far as continuous worldwide satellite measurements of sea level is a little laborious to collate and process by hand.


Back to the present day and the editorial attempts to blame those raising the alarm about climate change for the public confusion about it:
“The reality is that, despite the science, a good deal of uncertainty exists in the minds of many people, a situation that has not been helped by the exaggerated claims of some about what to expect.”

Sounding the alarm when there's a real threat is not alarmist, it’s prudent, that’s why we have fire alarms, and 000. In reality and as shown by some of the examples above, I’d wager a good deal of the uncertainty that exists is due to the exaggerated claims about the unknowns and uncertainties in climate science found in the media.


Ps: this post is, of course, an opinion piece and may not represent the views of TTKD, though I have certainly tried to keep it factually accurate.

Tuesday, November 9, 2010

Naomi Oreskes - Public Lecture: How a handful of scientists obscured the truth on issues from tobacco smoke to global warming

The Global Change Institute at UQ is hosting Naomi Oreskes for their final Insights Seminar of the year. Here are the details from the GCI website:


“Merchants of Doubt”
How a handful of scientists obscured the truth on issues from tobacco smoke to global warming

‘Naomi Oreskes and Erik Conway have demonstrated what many of us had long suspected: that the ‘debate’ over the climate crisis - and many other environmental issues - was manufactured by the same people who brought you ‘safe’ cigarettes.' Former US Vice President Al Gore

In this public lecture, Naomi Oreskes will "roll back the rug" on the dark corner of the American scientific community, showing how ideology and corporate interests, aided by a too-compliant media, have skewed public understanding of some of the most pressing issues of our era.
She will tell the story of how a loose-knit group of high-level scientists and scientific advisers, with deep connections in politics and industry, ran effective campaigns to mislead the public and deny well-established scientific knowledge over four decades.
Remarkably, the same individuals surface repeatedly - some of the same figures who have claimed that the science of global warming is ‘not settled’ denied the truth of studies linking smoking to lung cancer, coal smoke to acid rain, and CFCs to the ozone hole. ‘Doubt is our product,’ wrote one tobacco executive. These ‘experts’ supplied it.

When: Tuesday 16 November 2010, 5.30pm
Where: Abel Smith Theatre (Bldg 23), The University of Queensland, St Lucia (map)
RSVP here

--------------
Naomi Oreskes is a Professor of History and Science Studies at the University of California, San Diego.

Her research focuses on the historical development of scientific knowledge, methods, and practices in the earth and environmental sciences, and on understanding scientific consensus and dissent.
In 2004 Oreskes wrote an essay on science and society Beyond the Ivory Tower: The Scientific Consensus on Climate Change (Science, December 2004). In the essay she reported an analysis of “928 abstracts, published in refereed scientific journals between 1993 and 2003 and published in the ISI database with the keywords ‘global climate change’” After the analysis, she concluded that 75 percent of the examined abstracts either explicitly or implicitly backed the consensus view, while none directly dissented from it.

Monday, September 6, 2010

How many scientists does it take to change a skeptic?

Tongue in check perhaps, but on Tuesday night (7th of Sept) SBS Insight is a Q&A between renowned climate change scientist Prof Stephen Schneider and an audience full of climate skeptics.
Recorded before his untimely death in July, the program promises to be quite interesting. Stephen Schneider had a life long passion for engaging with the public and it will be interesting to see not only if he can educate and sway opinions but for those interested in communicating complex science to a skeptical public what does and does not work.

I'm also curious about the level of scientific knowledge of the skeptics and whether their skepticism appears based more on honestly held opinions and or ideology. I guess we'll see.


SBS Insight 7.30pm
Tues 7th of Sept

Thursday, August 26, 2010

The Science of Climate Change: Questions and Answers

The Australian Academy of Science is a prestigious body of Australia's most outstanding scientists. They have just released a short booklet on the science of climate change written by some of Australia's top climate scientists.
Scientific Academies tend to be quite conservative, so when they release reports like this you can be confident it is based on well established, consensus science. Highly recommended for anyone wanting to learn more about the science of climate change.

Download the pdf of view the booklet online here.

Wednesday, July 14, 2010

Climate scientists vindicated (again)

"On the specific allegations made against the behaviour of CRU scientists, we find that their rigour and honesty as scientists are not in doubt."

The fifth (and final) review into "Climategate", the Muir Russell Climate Change Email Review has just been released. This "forensic" report looked into allegations made against climate scientists from the Climate Research Unit (CRU) at the University of East Anglia. Like the four before it, the Muir Russell report found almost every allegation to be completely baseless, although like the preceding reports it faulted the scientists and the university for an unhelpful attitude towards freedom of information requests.

Crucially, these reports have found nothing that challenges or calls into question our understanding of climate change. More findings from the report are quoted below, the report can be found here, see reaction from the media and blogosphere.

"We did not find any evidence of behaviour that might undermine the conclusions of the IPCC assessments.

On the allegation of withholding temperature data, we find that CRU was not in a position to withhold access to such data or tamper with it.

On the allegations that there was subversion of the peer review or editorial process we find no evidence to substantiate this"
For those interested in whether CRU results could be independently replicated, well the inquiry did this themselves, with relative ease it seems:
"Finding: The computer code required to read and analyse the instrumental temperature data is straightforward to write based upon the published literature... Such code could be written by any research unit which is competent to reproduce or test the CRUTEM analysis. For the trial analysis of the Review Team, the code was written in less than two days and produced results similar too other independent analyses. No information was required from CRU to do this."

So how do actual climate scientists feel about this whole pseudoscandal? Judging by their comments many are extremely unhappy with how the media reported this story without questioning the veracity of many of the skeptics wild claims.

Prof Raymond Bradley:
"If there is a scandal to be reported at all, it is this: the media stoked a controversy without properly investigating the issues, choosing to inflate trivialities to the level of an international scandal, without regard for the facts or individuals affected. This was a shameful chapter in the history of news reporting, and a lesson for those who are concerned about fair and honest communication with the public."
Prof Myles Allen:
"What everyone has lost sight of is the spectacular failure of mainstream journalism to keep the whole affair in perspective. Again and again, stories are sexed up with arch hints that these "revelations" might somehow impact on the evidence for human impact on climate. Yet the only error in the actual data used for climate change detection to have emerged from this whole affair amounted to a few hundredths of a degree in the estimated global temperature of a couple of years in the late 1870s."
One can only hope that now the skeptics' claims have been shown to be without basis, journos in the future will be more "skeptical of the skeptics".

Wednesday, July 7, 2010

Summary of Climate Science

There's a great new article at RealClimate, summarising the science at a level accessible for those with a basic science knowledge (a little above those who can’t read an equation). It’s a good one to refer people to who have some science education and are not sure of the basics.

Sunday, June 6, 2010

NASA: Last 12 months is warmest on record

Global temperatures continue to march upwards


Global surface temperature index. Using 12 month running mean.
Volcanoes and El Nino/La Nina index is shown at bottom.

Jim Hansen and his team of climate scientists at NASA maintain a temperature record of the earth going back to 1880. With the release of their April 2010 data the last 12 months just become the warmest since the instrumental record began.

Or as they say in a draft of a new paper:

"The 12-month running mean global temperature in the GISS analysis has reached a new record in 2010. The new record temperature in 2010 is particularly meaningful because it occurs when the recent minimum of solar irradiance."

"we conclude that there has been no reduction in the global warming trend of 0.15-0.20°C/decade that began in the late 1970s"

Baring a strong La Nina, it also looks likely 2010 will be the warmest calendar year as well.

More coverage at Climate Progress, and here's a link to their paper draft if science/graphs and oodles of data are your sort of thing.

Monday, May 24, 2010

Book review blogging - David Archer - The Long Thaw


There are a lot of books written about climate change but this is surely one of the best.

I have just finished reading "The Long Thaw - How Humans Are Changing the Next 100,000 Years of Earth's Climate" by David Archer, Professor of Geophysical Sciences at the University of Chicago.


Concise (at under 200 pages), compelling and understandable to a non scientist, Archer lays out how our release of fossil fuel C02 today will affect the climate for tens if not hundreds of thousands of years.

Most discussion of climate change (and indeed IPCC predictions) tend to go only until 2100. Archer seeks to remedy this and in doing so takes us on a journey back through time to see how past climate changes played out, before showing how this knowledge allows us to predict what will happen in the future.

I've linked to the book on Amazon but you can also get it out from a BCC library. For those who are really keen David has put a whole course of lectures on youtube.

Note: Being a short focused book it doesn't cover all AWG topics. If you want to learn about the basics of the greenhouse effect, read in depth about climate change and the biosphere or about potential solutions then check out David Archer's - Understanding the Forecast, The Weather Makers by Tim Flannery and Our Choice - A plan to solve the climate crisis by Al Gore respectively.